Driver Ratings (Part 2 and 3) - Start Performance and Start Spatial Awareness
Each driver is awarded a rating based on their start performance on a scale of 0-10
Formula 1 is the pinnacle of motorsports. The cars are the fastest and most advanced in the world, and the drivers are some of the best athletes in all of sports. Formula 1 races are a spectacle to behold, with teams from all over competing for supremacy on some of the most challenging tracks in the world.
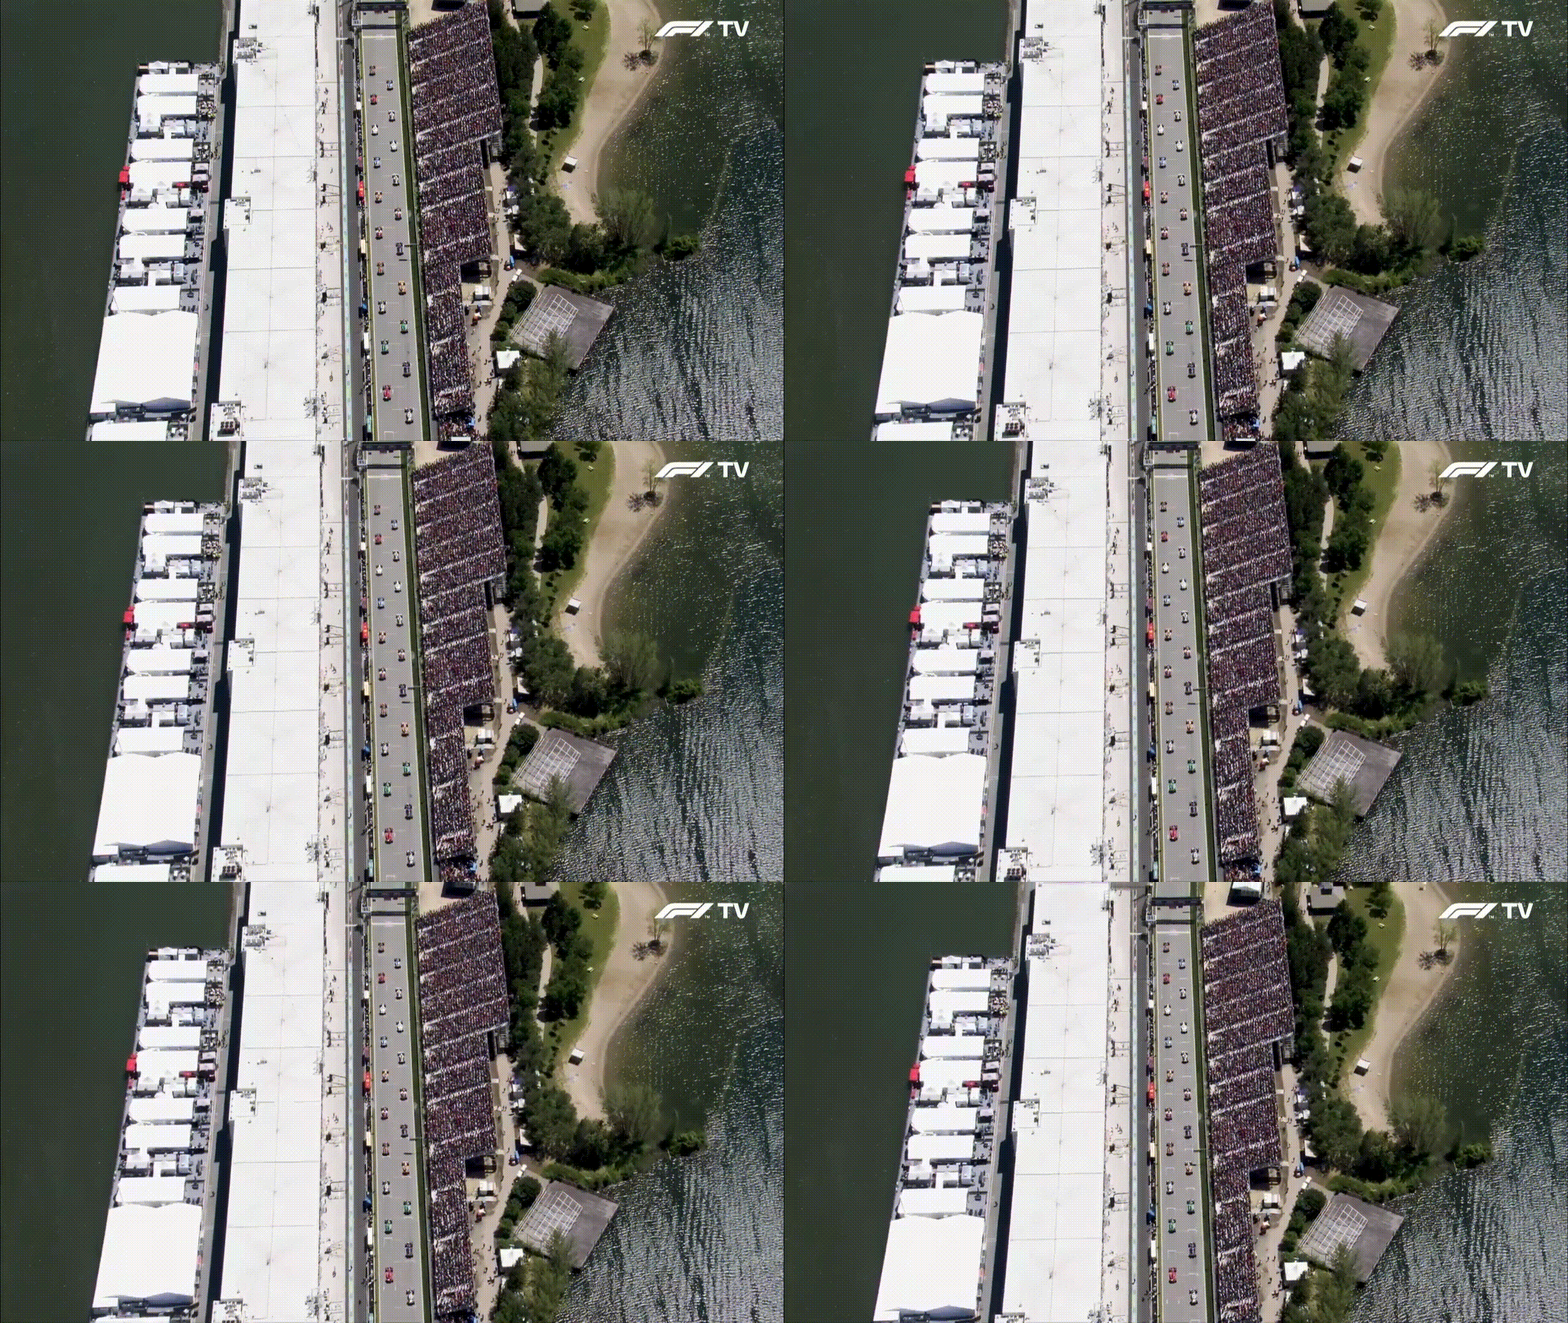
The start of a Formula 1 race is crucial; if you get off to a bad start, you may never be able to make up for it. The drivers line up on pit lane, waiting for that one moment when they can unleash their fury and race to victory. As they wait, their engines revving louder and louder, you can feel the excitement in the air. And when that light turns green, they're off!
The start of a Formula 1 race is an adrenaline rush like no other. It's pure excitement as those cars fly down pit lane and onto track, jockeying for position while trying not to make any mistakes that could cost them dearly later in the race. You never know who's going to come out on top at this point; it could be anyone!
“Given the importance of these initial few seconds of a Grand Prix race, the teams put a huge amount of effort into every detail. There are a number of precise and concurrent actions that the driver needs to carry out in harmony with the vehicle control system and power unit. This is by no means a simple task and requires, as is the norm in Formula 1, the optimal blend of both engineering and technical excellence and driving skills.
A simple example: too little throttle in the initial getaway phase will result in the engine bogging and the car pulling away at the slower acceleration than is optimum. On the other hand, too much throttle and the rear wheels will spin excessively. In turn, this also effects the optimum acceleration, and the driver therefore must judge this to perfection. Another example would be the clutch drop phase, here the driver has to manage the clutch position from the moment the lights go out to the point that they have fully engaged it.” - AWS
The launch can be categorized into 3 phases -
Reaction time phase - the time from when the start lights go out to when the driver reacts by dropping the hand clutch to the mid (semi engaged/semi slipping) position.
Initial acceleration phase – how the driver handle the wheelslip, the throttle position, fully releasing the clutch paddle to full engagement, etc.
How fast are the car and driver in the latter part of the launch – using the slip stream, the overall drag of the car, holding position (making as few changes of direction as possible), etc.
Start Performance:
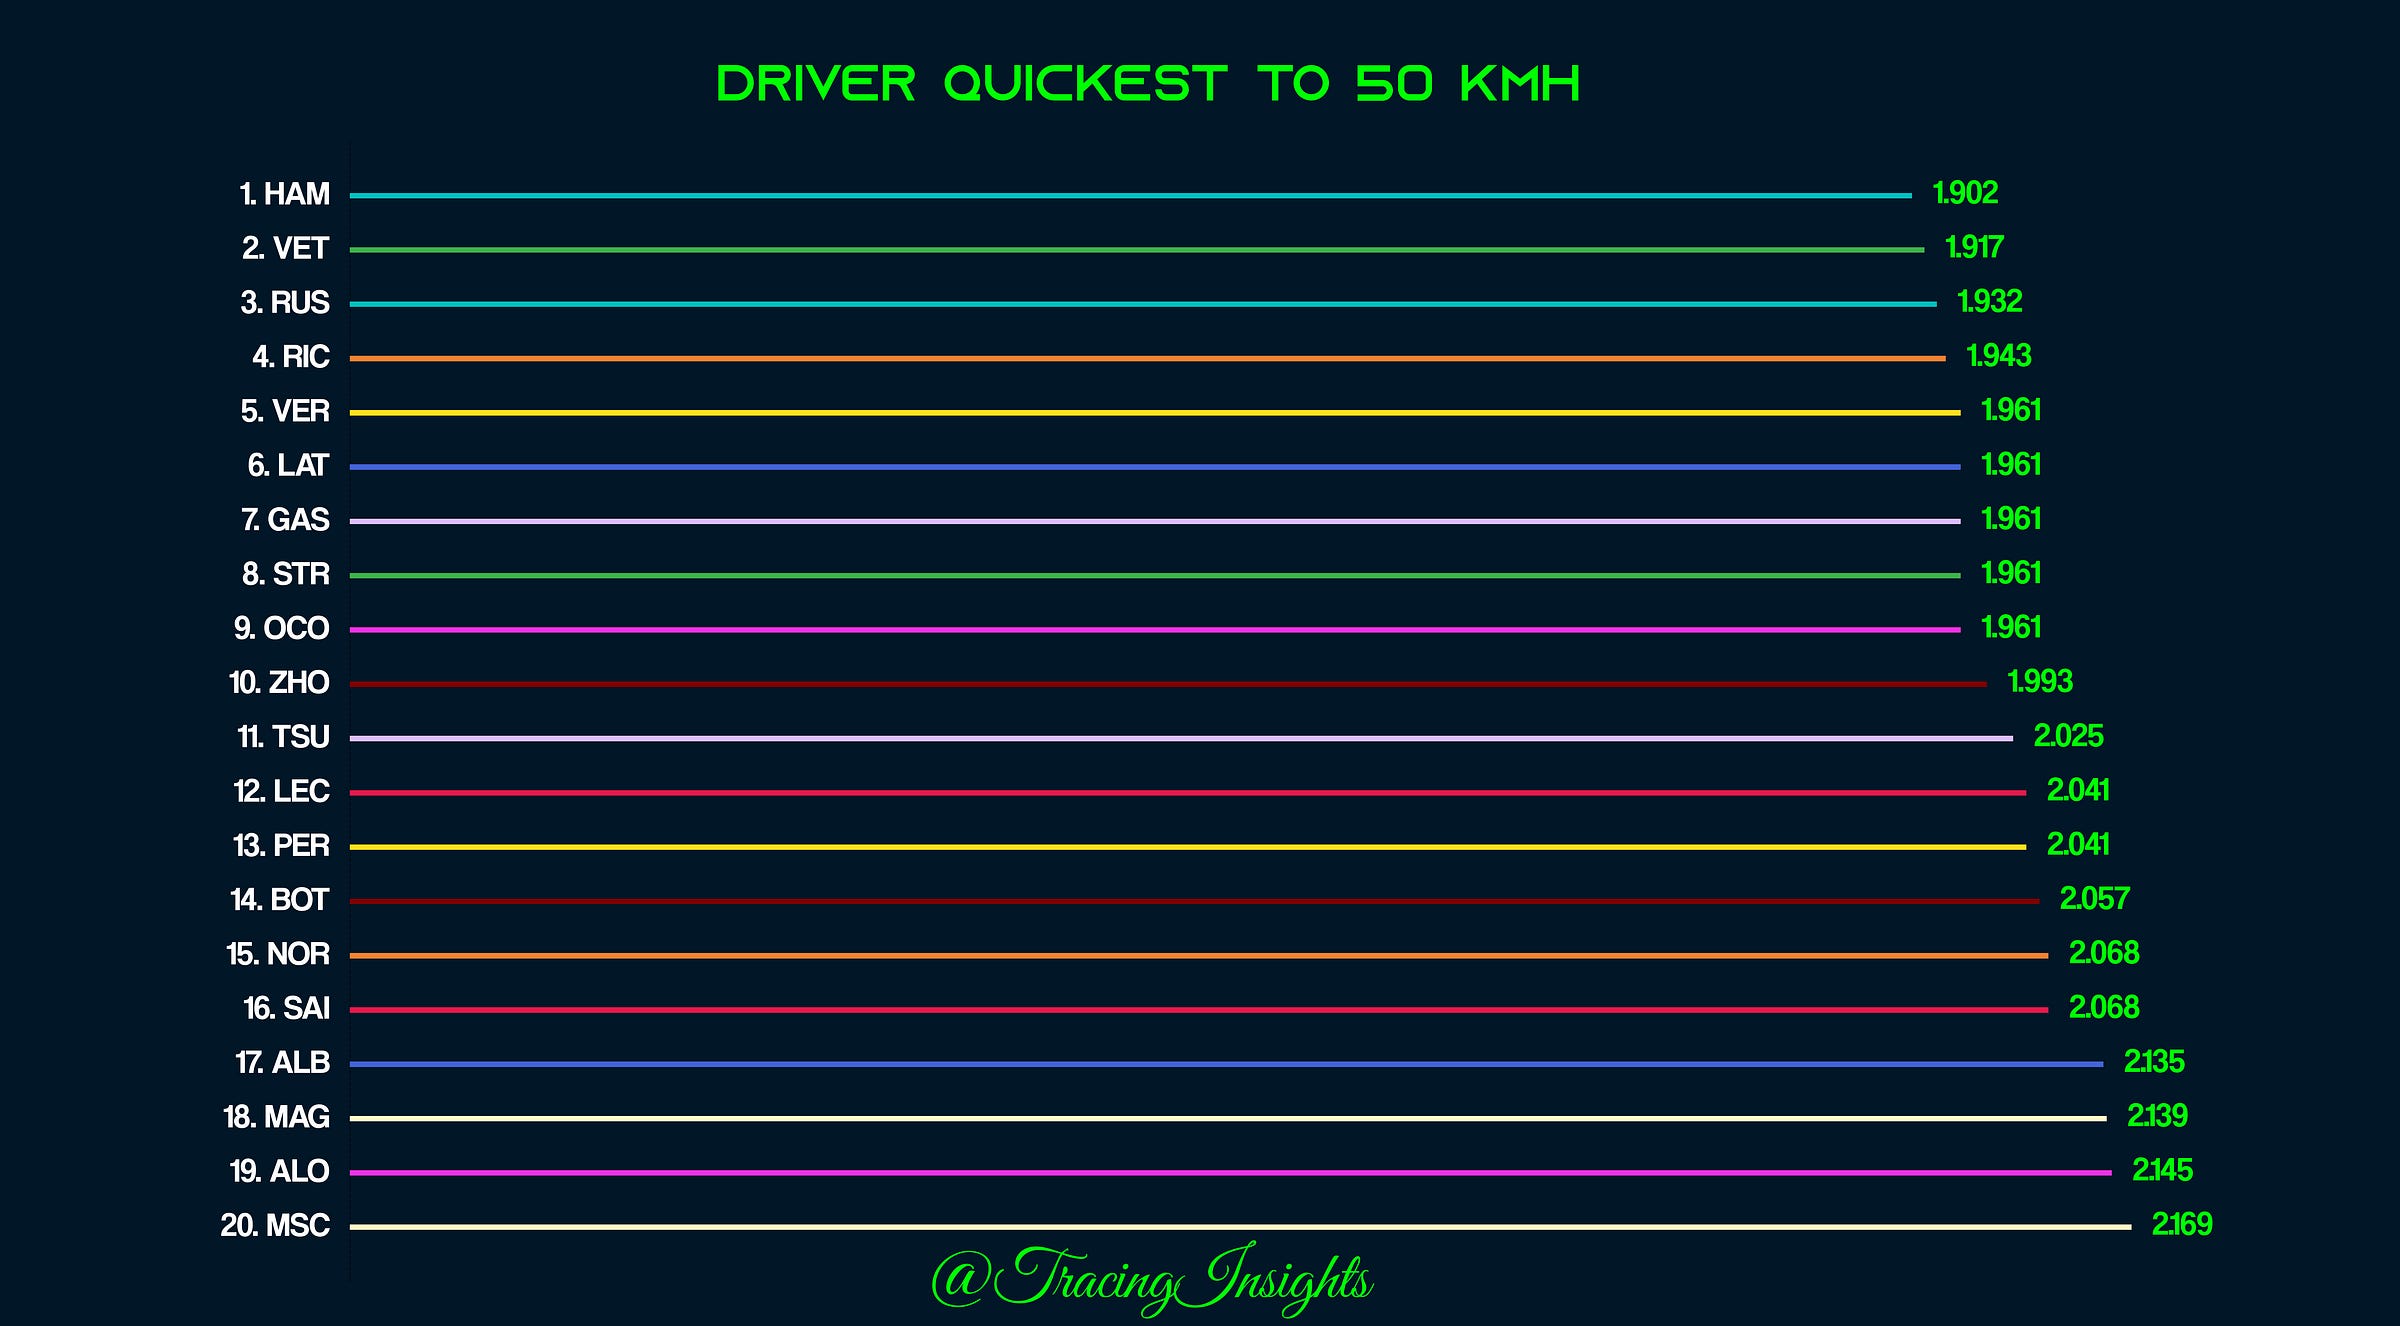
This chart below is from the 2022 Canadian GP showing driver quickest to 50kmph from lights out , meaning it also includes the reaction time. Alonso starting from P2 had a poor start but equally Sainz also had a bad start, allowing Alonso to have a breathing room before the first corner. With no feeder series such as F2 or F3 races to lay the rubber down, and rain washing away the grip during qualification had its impact on slower times from all drivers.
These are interesting to look at, and it shows that the margin is very small between the drivers. In order to normalize this data to make it easy to compare across circuits we use min-max scaler and later multiply with 10 to get each driver ratings on a scale of 0-10. For the Canadian GP, Hamilton scored the most points with his ninja-like reaction time and smooth getaway. Mick Schumacher starting from his highest ever grid position of P6 had a poor start falling back during the starting lap, had a rating of 0. For every race start, due to the nature of the math, we will have the fastest driver with 10 rating points and slowest driver with 0 rating points. I would like to refer this as the ‘Start Performance’ or SP for short.
Start Spatial Awareness(SA):
After the initial launch and driver succesfully getsaway, they have to think of a plan of attack going into the first corner. From my research for every circuit, the distance to the first corner is long enough to allow the drivers to get to 100 kmph. Since, my goal is to compare driver performances across seasons and circuits, we standardize our calculations by taking 100kmph as upper bound.
From around 50 kmph to 100 kmph, we can calculate each drivers performance and rate them on a scale of 0-10 similar to our previous metric. The data publicly available is sampled at a low frequency, so we use a linear interpolation to get the durations from 0-50 and 50-100 kmph. This rating is indicative and a good representation for ‘Driver’s Start Spatial Awareness(SA)’
Stay tuned for Part 4 and 5 of driver’s ratings


Canadian GP Memes


Not sure how much the 50-100 is due to spatial awareness of the drivers vs. just which cars accelerate fastest. There doesn't seem to be a ton of correlation between teammates from 0-50, likely making that more driver-dependent, but 50-100 is a much different case.
Please share your thoughts, ideas and feedback here